Visualization
dag(output) renders the graph to SVG. With cache_dir, each step is colored by its state:
cached (green), pending (yellow), or blocked (red, the step has no key, for example a
FileSource field whose file is missing).
"""Visualization: render the graph to SVG, colored by cache state."""

import sys
import tempfile
from dataclasses import dataclass
from pathlib import Path

from pydantic import BaseModel

from adag import InputParam, NullObserver, Pipeline, Step, dag


class Number(BaseModel):
    value: int


@dataclass(frozen=True)
class Square(Step[Number]):
    def run(self, x: int) -> Number:
        return Number(value=x * x)


@dataclass(frozen=True)
class AddOne(Step[Number]):
    def run(self, n: Number) -> Number:
        return Number(value=n.value + 1)


x = InputParam[int].with_default("x", 4)
total = AddOne()(n=Square()(x=x))
cache = Path(tempfile.mkdtemp())
Pipeline(total, cache_dir=cache).execute(observer=NullObserver())

out = Path(sys.argv[1]) if len(sys.argv) > 1 else cache / "graph.svg"
svg = dag(total, cache_dir=cache, path=out)
print(f"wrote {out.name}: {len(str(svg))} characters")
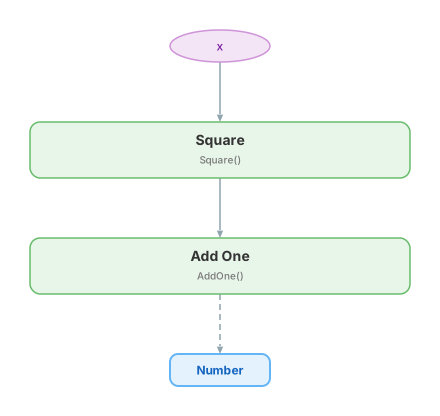
dag takes no run params. It computes each key with the InputParam defaults, not with the
values of your last run. A step that depends on a required InputParam shows as pending even
after a run.
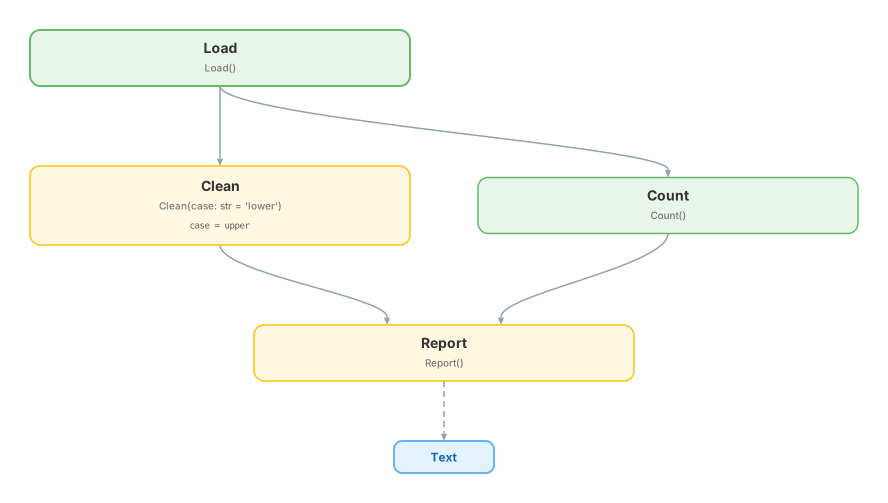
Here a pipeline ran once, then the case field of Clean changed. Clean and Report are
pending (yellow). Load and Count are still cached (green).
In a notebook, the returned SVG object displays inline. Use SvgOptions to change the theme
or hide the per-step parameters.
Draw the graph your own way
walk(output)returns theNodeandEdgelists.node_metadata(nodes, cache_dir=, prefix=)returns oneNodeMetadataper node: whatdagwould draw.- Change the ones you want with
dataclasses.replace. render_graph_svg(metadata, pairs)returns the SVG text.pairsare(source, target)names.
"""Change what one node shows, then draw the graph."""

from dataclasses import dataclass, replace

from pydantic import BaseModel

from adag import InputParam, Step, node_metadata, render_graph_svg, walk


class Number(BaseModel):
    value: int


@dataclass(frozen=True)
class Square(Step[Number]):
    def run(self, x: int) -> Number:
        return Number(value=x * x)


nodes, edges = walk(Square()(x=InputParam[int]("x")))
metadata = [
    replace(m, title="Square the input", description="x * x") if m.name == "Square" else m
    for m in node_metadata(nodes)
]
svg = render_graph_svg(metadata, [(edge.source, edge.target) for edge in edges])
print([(m.name, m.kind, m.state) for m in metadata])
print(type(svg).__name__, "Square the input" in svg)
compute_state(node, cache_dir)returnsCACHED,PENDING,BLOCKEDorSOURCEfor one node.render_graph_svgreturnsstr.dagreturns anSVGobject;str(svg)is the SVG text.Node,Edge,NodeMetadata,compute_state,node_metadataandrender_graph_svgimport fromadag. Their names and fields stay stable. The old private name_render_graph_svgworks until 1.0.